Mullaney on the Markets
Have the bond vigilantes awakened from
their hibernation?
By Michael Mullaney | Director of Global Markets Research
Published November 11, 2024
A drop of –1.85% on the last day of the month pushed the S&P 500 Index into negative territory for October with a decline of –0.91%. This was its first loss in five months, but the fourth consecutive loss for the index in the October of an election year.
On October 18, the index had advanced by 1.84%, hitting its 47th record high for the year. It eventually succumbed to the same pressure that pushed the Bloomberg U.S. Aggregate Bond Index down –2.48% as interest rates rose by an average of 56 basis points for Treasuries, with maturities ranging from two to ten years in length. Strong economic data, the likelihood of an expanding fiscal deficit, and fears of a reacceleration of inflation weighed heavily on bonds. Microsoft and Meta Platforms, though reporting strong Q3 revenue and earnings results, saw their stock prices drop on the last day of the month when both companies emphasized in their earnings calls that significant CapEx spending would remain in place for the foreseeable future as the firms forge ahead with their artificial intelligence (AI) initiatives. Microsoft’s capital expenditure was up 79% year-over-year for the quarter, while Meta Platforms was up 36%, suggesting the figure would be even higher in 2025. The two stocks were a large part of the S&P 500 final-day sell-off.
The year-to-date return for the S&P 500 Index remained robust at 20.97%, while the Bloomberg U.S. Aggregate Bond Index gained 1.86%.
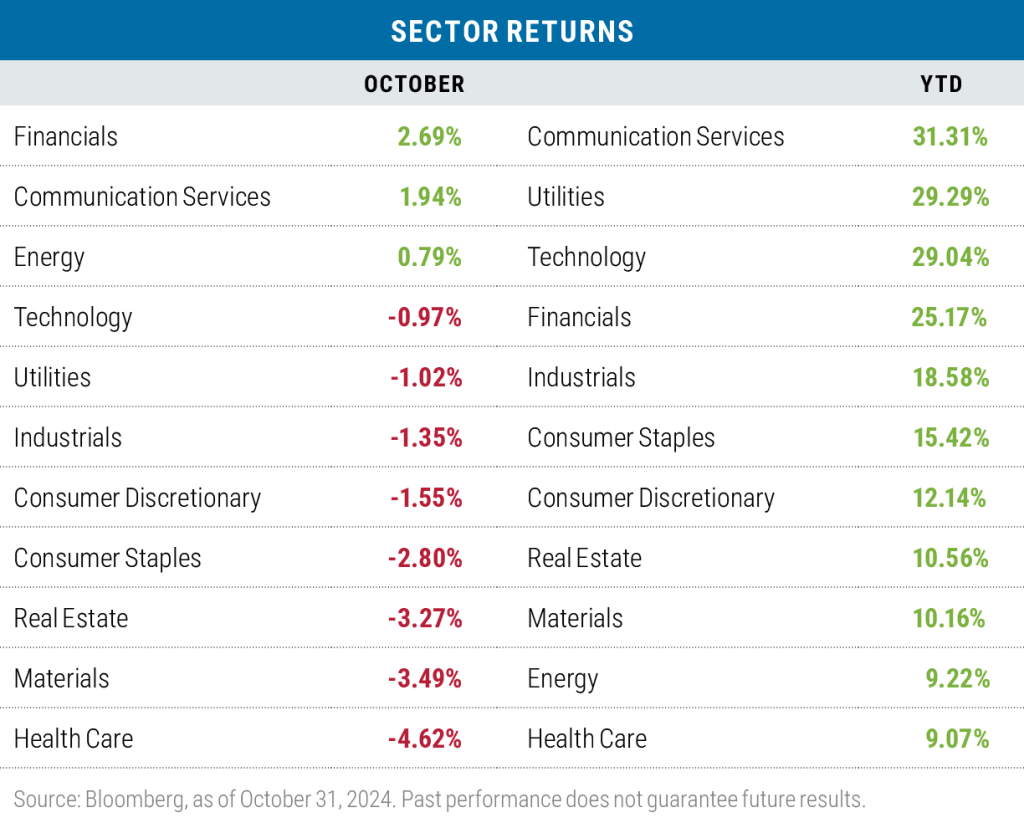
Only three sectors posted positive results in October
Financials led all sectors in October as several banks and wealth management firms reported Q3 earnings results that generally exceeded consensus expectations. Wells Fargo (up 14.92%) and Morgan Stanley (up 12.41%) were two prominent contributors. Communication Services was aided by gains from Alphabet and Netflix, the latter posting Q3 earnings of $5.40 versus the $5.12 consensus estimate and reporting new subscriptions that nearly doubled Wall Street’s expectations.
Health Care pulled up the rear with 76% of the companies in the sector posting losses during the month. It is widely believed that no matter who wins the presidential election, there will continue to be price pressures placed on pharmaceutical companies and health care providers to control spiraling consumer costs.
Year-to-date, Communication Services led all sectors with the help of two stocks, Alphabet and Meta Platforms, which collectively made up 70% of the sector’s weight and accounted for 78% of the sector’s return. Health Care, while posting a positive return year-to-date, lagged the other sectors due to the aforementioned price pressures.
Concentration risk remained a concern, as the Magnificent Seven stocks continued to account for 30% of the S&P 500 Index’s weight and 48% of the benchmark’s return with a gain of 43.82%. The “S&P 493,” meanwhile, returned 15.36% year-to-date, and the S&P 500 Equal Weight Index advanced by 13.27% year-to-date versus the traditional cap-weighted return of 20.97%.
Risk characteristics remained mixed in October
While both high-beta and low-quality stocks performed better in October, the returns skewed more toward those categories within large-capitalization stocks, as small-cap stocks continued to lag.
The risk-on trade was more prevalent on a year-to-year basis, with low quality/high beta outperforming, but once again concentrated in large-capitalization names. Communication Services, which led all sectors year-to-date, had a beta of 1.12.
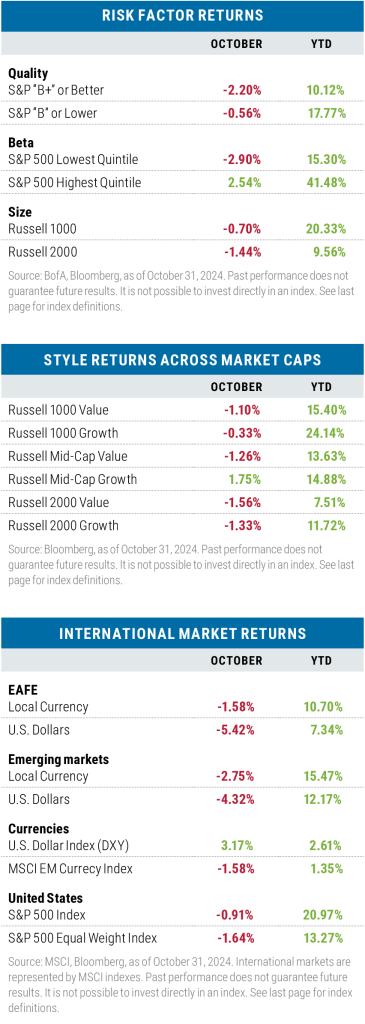
Growth stocks led in October and year-to-date
Growth remained the dominant style factor in October with the largest disparity recorded in the mid-cap space, where all 11 sectors in the Russell Mid-Cap Value Index lagged their growth counterparts. The biggest drag for mid-cap value was in the industrial sector, which dropped by –0.88% compared with a gain of 3.66% for the same sector in the mid-cap growth index. For the year, growth remained the leader across all three style capitalizations primarily due to the relative outperfor- mance of the Information Technology sector, particularly in the large- and small-cap space.
Non-U.S. stock returns lagged in October
Returns for international developed- and emerging-
market stocks lagged the S&P 500 Index in October
in both local currency and U.S. dollar (USD) terms, as
a significant increase in U.S. interest rates during the
month pushed the USD higher. Returns for Japan were
particularly weak, dropping by –3.08% in Yen terms
and by –4.50% in dollar terms as Japan Prime Minister
Shigeru Ishiba and his Liberal Democratic Party lost
ground in the snap election that was called during the
month. Year-to-date, both developed and emerging
markets continued to lag the S&P 500, largely due to
lower exposure to technology stocks and no exposure
to NVIDIA, which gained more than 168% for the year.
Did the Fed cut rates too much, too soon?
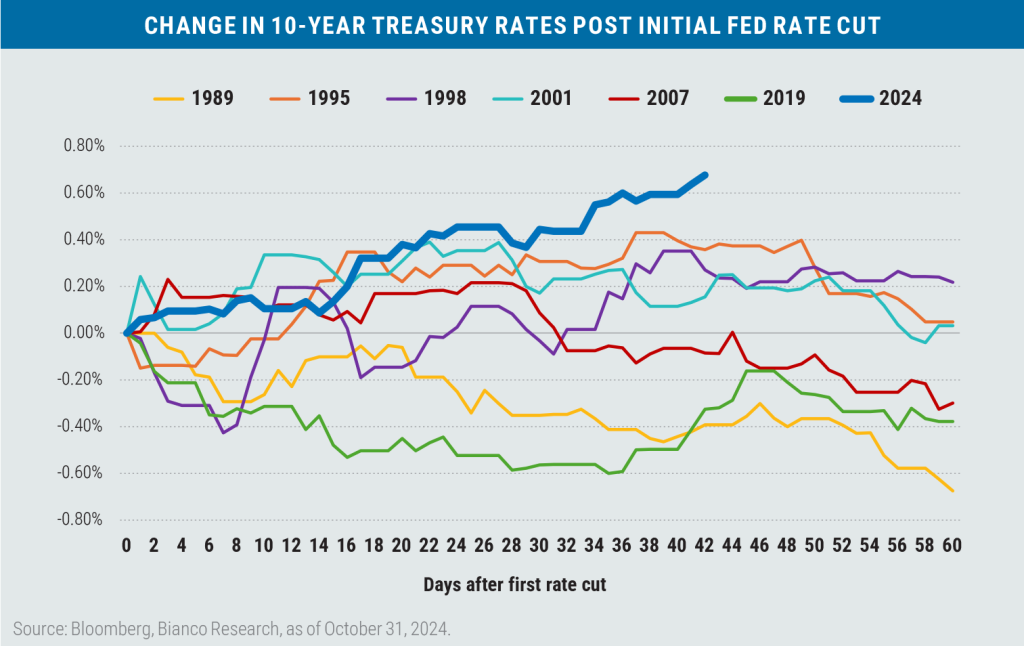
Economist Dr. Ed Yardeni coined the term “bond vigilantes” in 1983 in response to the sell-off in the bond market led by investors who demanded to be compensated for high and stubborn inflation. In October, we saw a mini replay of that event, coupled with the fear of a continued deterioration of the U.S. budget deficit, as neither presidential candidate stressed fiscal austerity as a policy platform. This was reflected in the increase in the yield of the 10-Year Treasury since the Fed rate cut of 50 basis points on September 18, the largest on record going back to 1989.
The rate cut was also unusual in that GDP growth remained above trend, inflation continued above the Fed’s target, the economy was running at full employment, and financial conditions were already accommodative. The only other times financial conditions were this loose at the start of an easing cycle were in 1995 (Greenspan’s soft landing) and in 2019 (just before the COVID disruptions).
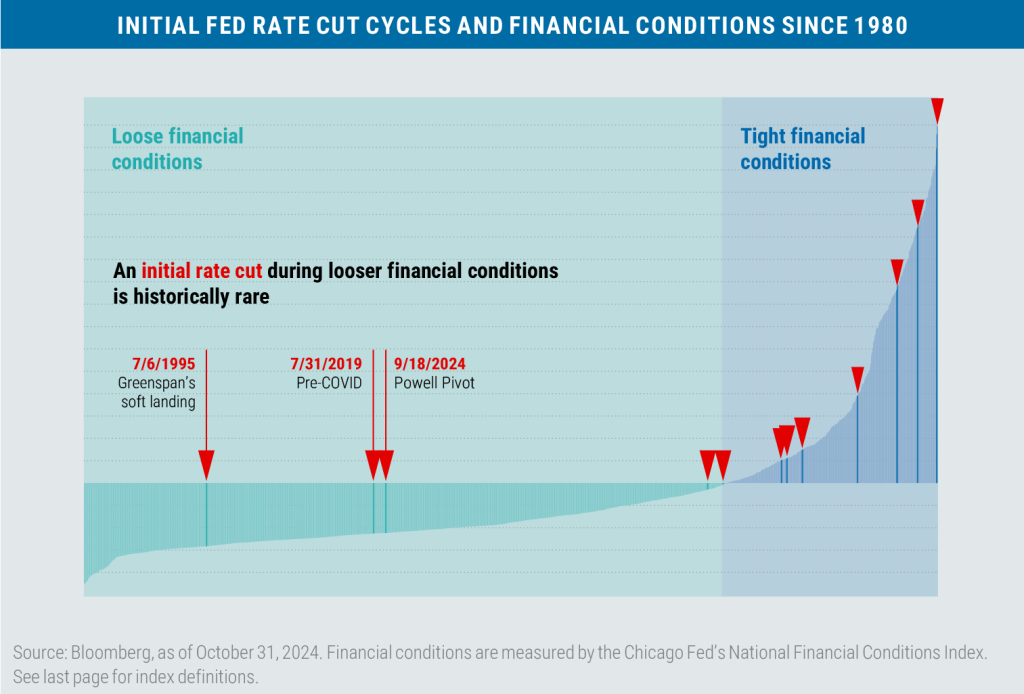
Unless economic conditions deteriorate, the five (or more) rate cuts priced in by the fed funds futures market for 2025 should be viewed with some degree of skepticism.
Revenue and earnings growth remained supportive of additional price gains
To date, 362 S&P 500 companies reported results for the third quarter. Average sales came in at 5.2% with 60% of the companies beating top-line expectations, outpacing the consensus by an average of 1.1%. Earnings growth to date averaged 5.64%, with 75% of the companies beating expectations by an average of 4.6%. Companies beating on both the top and bottom line gained 2.0% on average versus the five-year average of 0.9%. Companies missing on both revenues and earnings dropped by –3.3% versus a five-year average of –3.1%.
For Q4 2024, analysts are projecting earnings growth of 12.7% and revenue growth of 4.8%, and for the full year, S&P 500 earnings are expected to advance by 9.3% on revenue growth of 5.0%. We believe these increases should bode well for stock prices as long as interest rates don’t catch the markets off guard and trigger a compression of P/E multiples.
Election year price momentum points to ongoing strength for the S&P 500
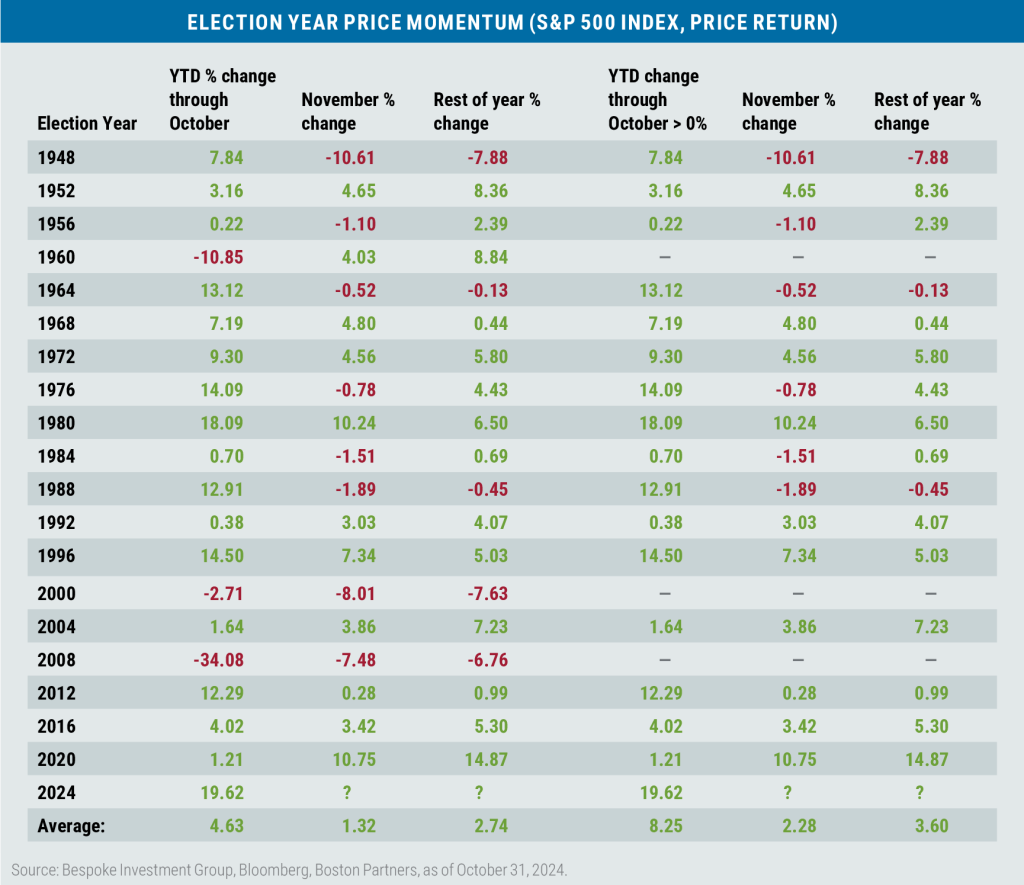
Since WWII, positive price returns for the S&P 500 through October in election years have gone on to produce positive returns in November 63% of the time and 81% of the time over the remainder of the year. While it’s been a year full of surprises, if history is any guide, the home stretch appears favorable for equities as we close out 2024.
7284405.1
Disclosures:
Boston Partners Global Investors, Inc. (“Boston Partners”) is an investment adviser registered with the SEC under the Investment Advisers Act of 1940.
The views expressed in this commentary reflect those of the author as of the date of this commentary. Any such views are subject to change at any time based on market and other conditions and Boston Partners disclaims any responsibility to update such views. Past performance is not an indication of future results. Discussions of securities, market returns, and trends are not intended to be a forecast of future events or returns. You should not assume that investments in the securities identified and discussed were or will be profitable.
The views and opinions expressed reflect those of Boston Partners as of the date of publication and may change based on market and other conditions. There can be no assurance that developments will transpire as forecasted.
Terms and definitions
Beta is a measure of a portfolio’s market risk relative to its benchmark. In general, a beta higher than 1.00 indicates a more volatile portfolio and beta lower than 1.00 indicates a less volatile portfolio in relation to its benchmark. Bond credit ratings are measured on a scale that generally ranges from AAA (highest) to D (lowest). Capital expenditures (CapEx) are investments made by a business to obtain or improve physical assets. The Magnificent Seven stocks are a group of high-performing and influential companies in the U.S. stock market: Alphabet, Amazon, Apple, Meta Platforms, Microsoft, NVIDIA, and Tesla.
The Bloomberg U.S. Aggregate Bond Index tracks the performance of intermediate-term investment-grade bonds traded in the United States. The Chicago Fed’s National Financial Conditions Index (NFCI) provides a comprehensive weekly update on U.S. financial conditions in money markets, debt and equity markets, and the traditional and “shadow” banking systems. Positive values of the NFCI indicate financial conditions that are tighter than average, while negative values indicate financial conditions that are looser than average. The MSCI Emerging Markets (EM) Currency Index tracks the performance of emerging market currencies relative to the U.S. dollar where the weight of each currency is equal to its country weight in the MSCI Emerging Markets Index. The MSCI EAFE Index tracks the performance of large- and mid-cap equities traded across global developed markets, excluding the United States and Canada. The MSCI Emerging Markets Index tracks the performance of large- and mid-cap equities traded in global emerging markets. The Russell 1000 Index tracks the performance of the 1,000 largest companies traded in the United States. The Russell 2000 Index tracks the performance of the 2,000 smallest companies traded in the United States. The Russell 1000 Growth and Value Indexes track the performance of those large-cap U.S. equities in the Russell 1000 Index with growth and value style characteristics, respectively. The Russell 2000 Growth and Value Indexes track the performance of those small-cap U.S. equities in the Russell 2000 Index with growth and value style characteristics, respectively. The Russell Midcap Index tracks the performance of the roughly 800 smallest U.S. companies in the Russell 1000 Index.
The Russell Midcap Growth and Value Indexes track the performance of those mid-cap U.S. companies in the Russell 1000 Index with growth and value style characteristics, respectively. The S&P 500 Index tracks the performance of the 500 largest companies traded in the United States. The U.S. Dollar Index (DXY) is used to measure the value of the dollar against a basket of six foreign currencies. The value of the index is a fair indication of the dollar’s value in global markets. It is not possible to invest directly in an index.


